Assessment of progress along the value chain.
|© Ecologic Institute, 2026


Assessment of Progress Along the Value Chain
- Publication
- Citation
ECNO (2026): Clean Industrial Transition Monitor – Progress, Gaps and Policy Implications of the Clean Industrial Deal. Infographic (CC BY 4.0).
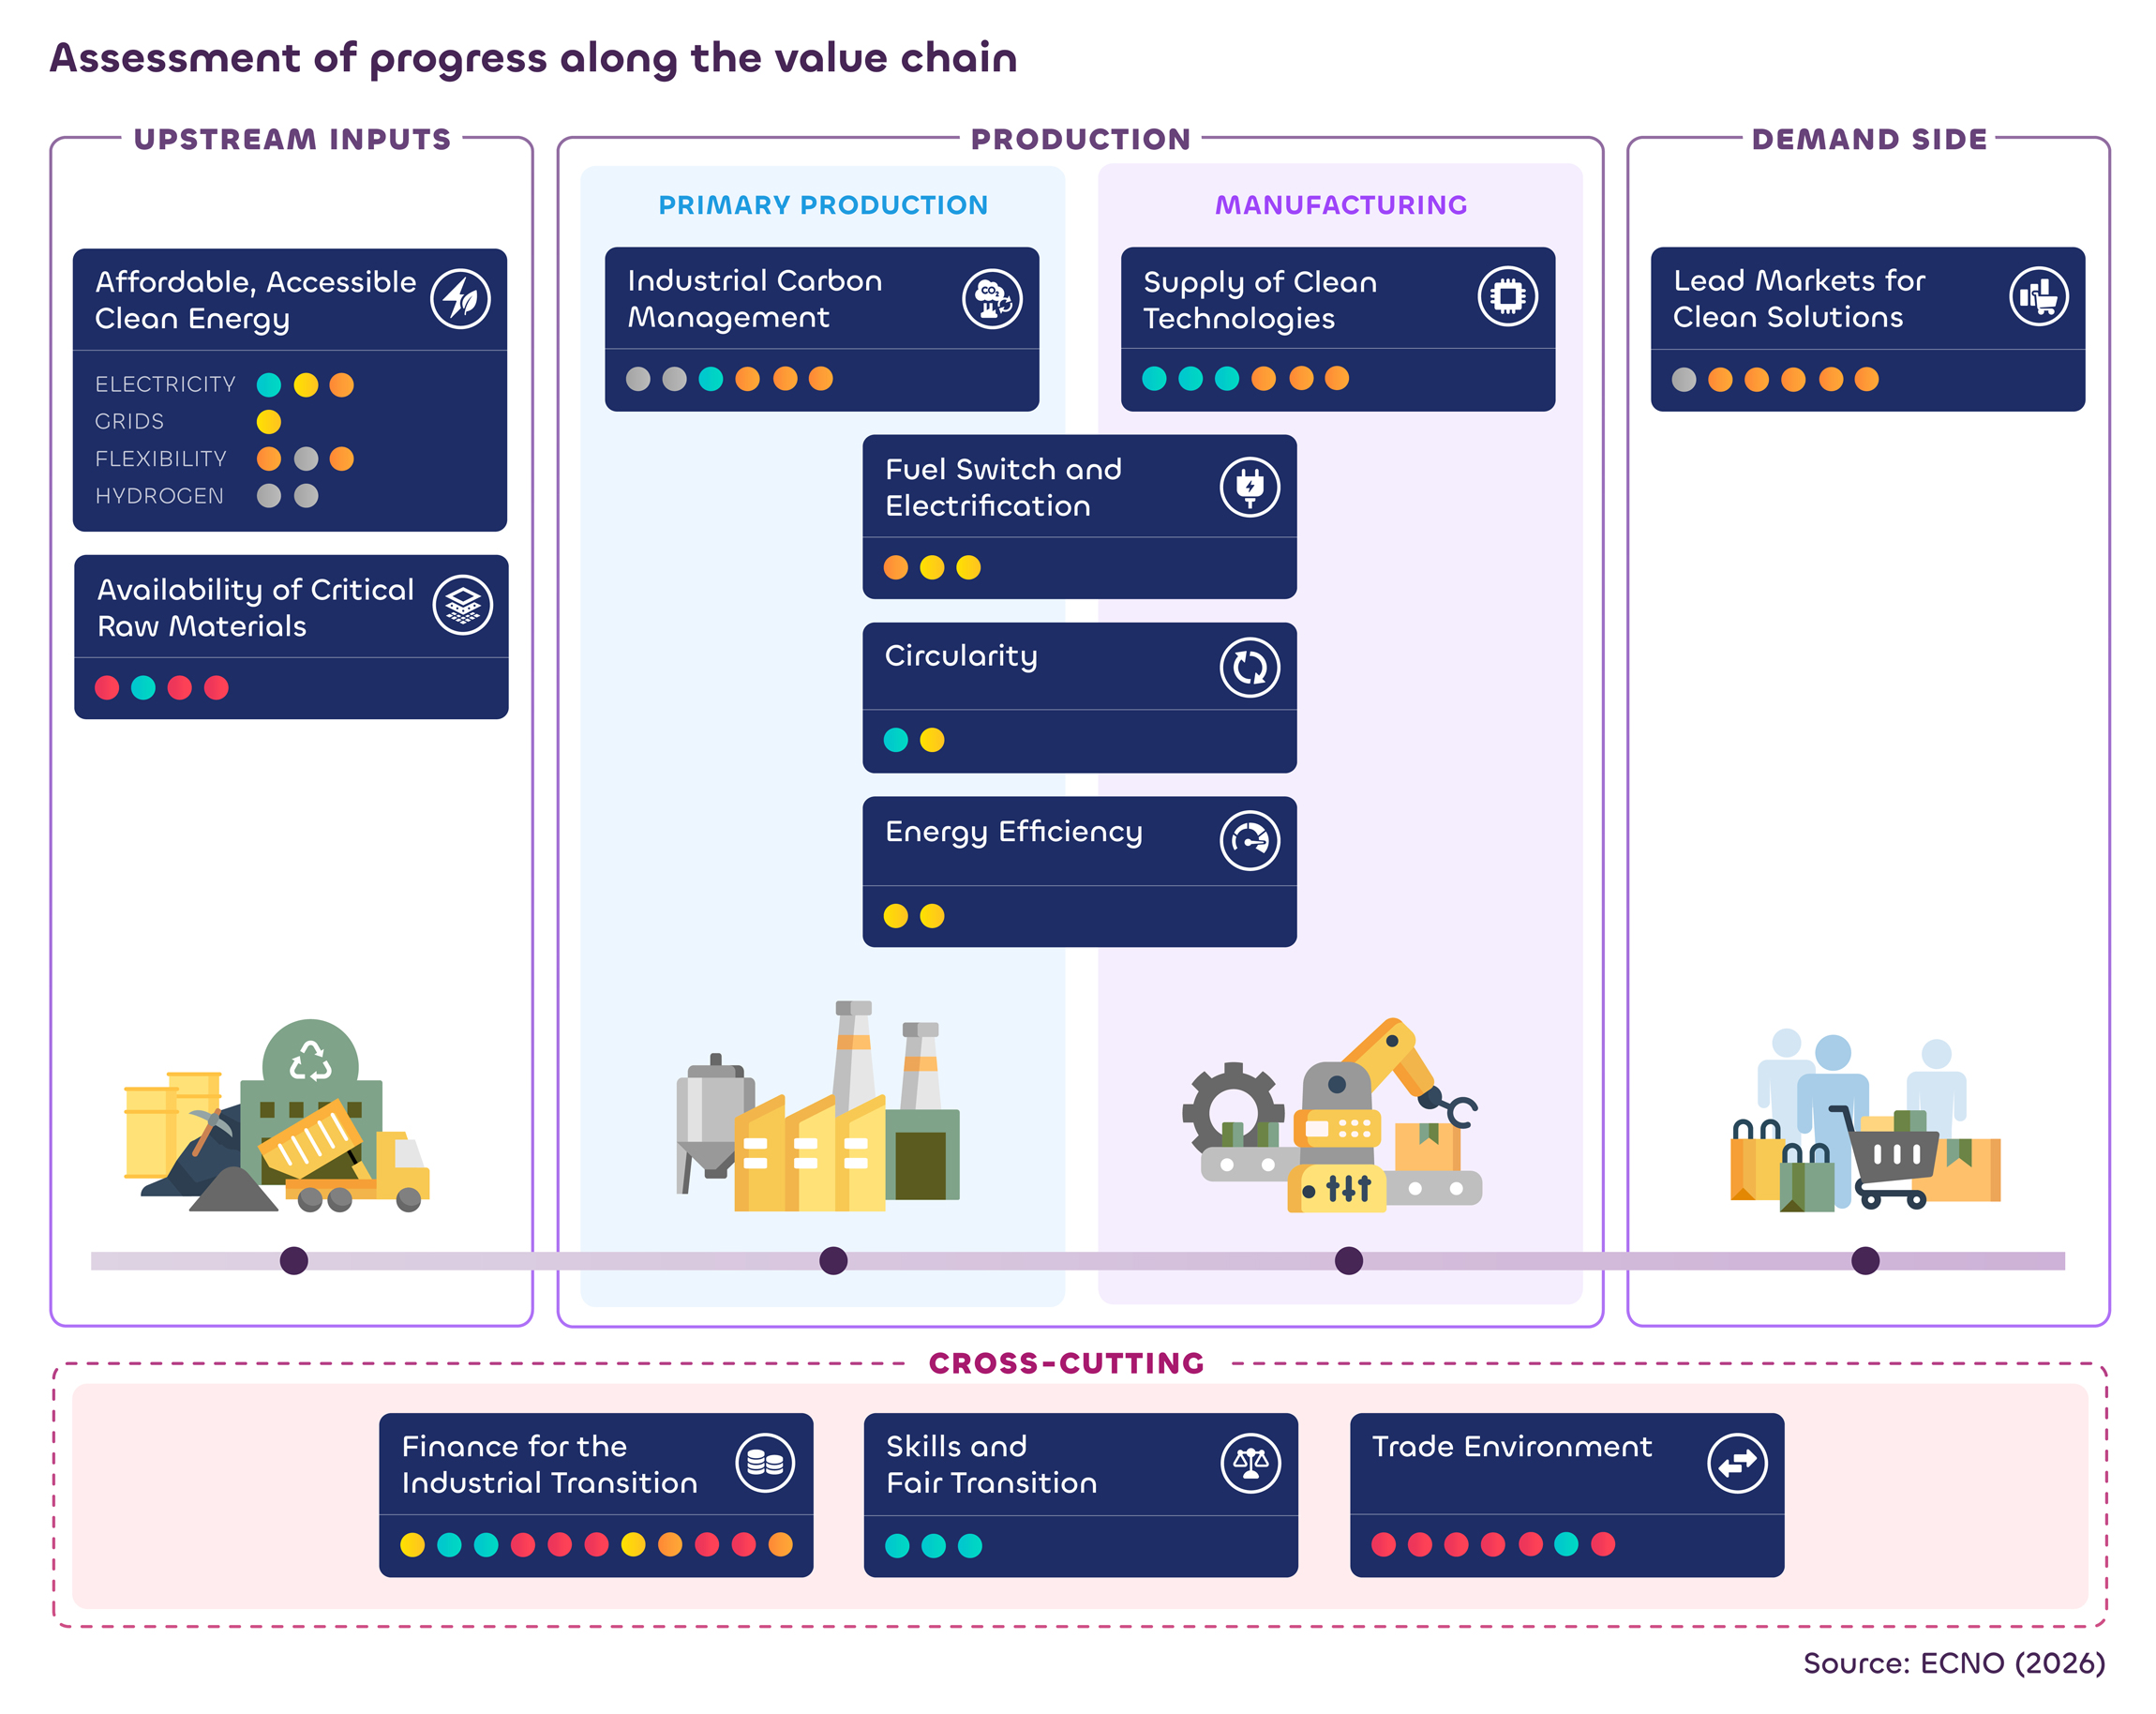
The Clean Industrial Transition Monitor shows how Europe is moving towards a climate-neutral industry along the whole industrial value chain. This includes everything from the inputs needed for production, like energy and raw materials, to the demand side.
The infographic shows that while progress is visible in several areas, the transition remains uneven. Improvements in clean technologies and industrial processes contrast with persistent bottlenecks, particularly in the availability of critical raw materials, infrastructure constraints, and the creation of reliable demand for clean products. These gaps continue to limit the pace and scale of industrial transformation.
Industrial transition as a system-wide challenge
Importantly, the visual highlights that no single factor determines success. Instead, progress depends on the interaction of multiple enabling conditions across the value chain. Affordable clean energy, circular material use, electrification, and efficient manufacturing must align with demand-side signals such as lead markets for clean solutions.
In addition, cross-cutting conditions – including financing, skills and fair transition, and the global trade environment – play a decisive role in shaping outcomes. Weaknesses in these areas can slow progress along the industrial value chain.
The infographic underscores a central insight of the Clean Industrial Transition Monitor: Europe has put in place many of the necessary building blocks for a clean industrial transition. However, achieving scale will depend on addressing remaining bottlenecks and ensuring coherent implementation across all parts of the value chain.
About this infographic
This infographic is part of the Clean Industrial Transition Monitor developed by ECNO. Published under a CC BY 4.0 license, it may be shared and adapted provided that the source is credited. We encourage its use and dissemination to support a better understanding of the systemic dynamics, challenges and policy pathways of Europe’s clean industrial transition in policy, research and practice.
Contact